

Chapter 2
Now Stop Reading and Start Riding the Bike
Use the models below to connect the seat of your intellect to the seat of your pants.
The Flaw of Averages Trilogy: Behind Schedule, Below Projection, and Beyond Budget
Behind Schedule
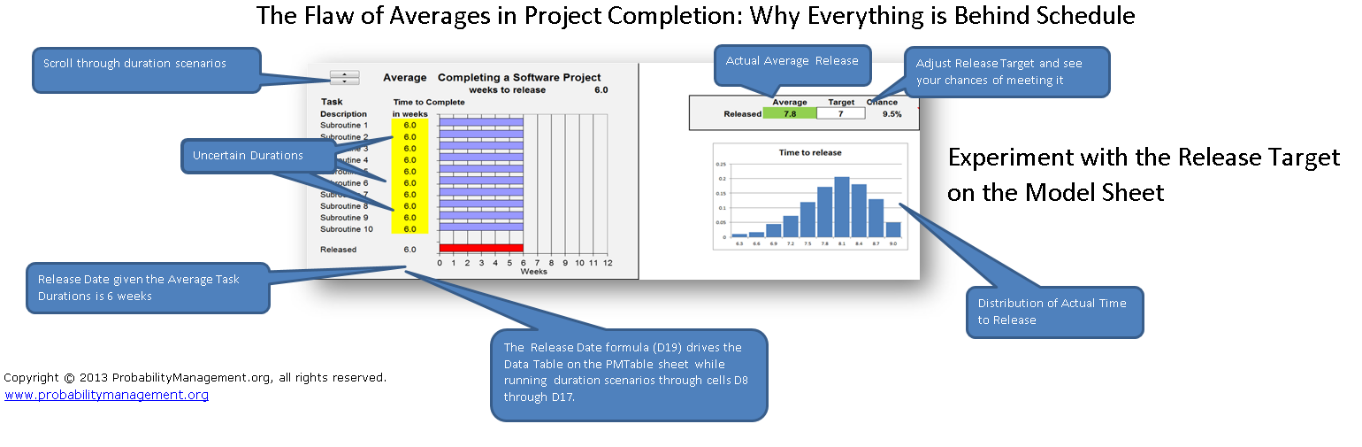
The Average Project Completion Time is greater than that predicted by the Average Durations of the underlying tasks, because the project is not done until the last task is done. See Introduction and Ch. 1.
Below Projection
Goods must be purchased in the face of uncertain demand. The Average Profit is less than the Profit of the Average Demand because there is no upside if Demand exceeds quantity ordered. See Ch. 1.

Beyond Budget
Inventory must be held in the face of uncertain demand. The Average Operating Cost is greater than the Operating Cost of the Average Demand because there are penalties both when Actual Demand exceeds the stocking level, and when it falls short. See Ch. 1.

Climate Change
Flood Model
The Average projected Flood Damage is greater than that Damage of the Average Flood, because the consequences increase at an increasing rate with crest height.

Doing for Uncertainty what Hindu/Arabic Numerals did for Numbers
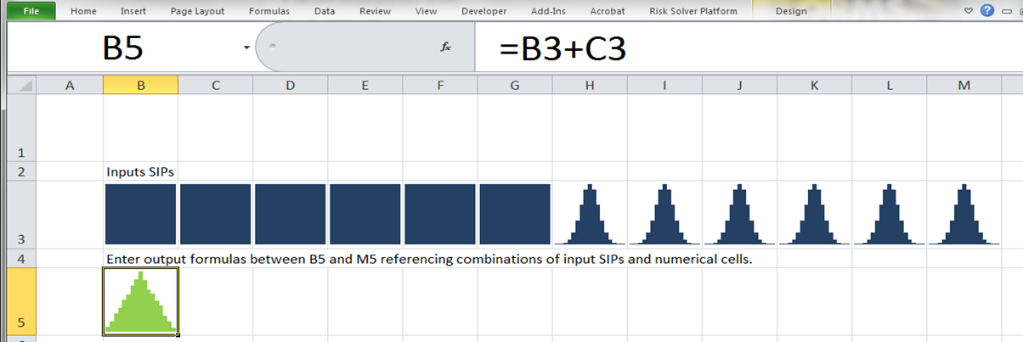
Sparkland
This model lets you actually do arithmetic with histograms. As shown in the image, we see that the sum of two independent uniforms is a triangle. This model helped convince the early corporate sponsors of ProbabilityManagement.org to get on board.
Dice Calc
Author Nicholas Taleb, author of The Black Swan, coined the term Ludic Fallacy to describe the belief that real life uncertainties can be adequately modelled by simple examples such as dice. I agree, but have coined the term Ludic Fallacy Fallacy to describe the belief that you can understand real world uncertainties without first understanding dice. This model rolls three dice 10,000 times per keystroke. The difference between rolling a single die or summing two or three dice has profound implications. See Ch. 10.

Foundational Models at Shell and Bessemer Trust
The Shell Exploration Portfolio Model
In 2005, Royal Dutch Shell could simulate each of its oil exploration sites but did not have a systematic way to simulate its full portfolio. This prototype of the first industrial scale application of probability management is described in the ORMS Today articles described in Chapter 2, and in detail in Ch. 29.

Retirement
If you assume the average performance of the assets in your retirement portfolio, you won’t realize you have a chance of going broke. This is a design study of the first commercial application of what was later dubbed probability management. It was co-developed with Andy Parker for Bessemer Trust in 2000, as described in ORMS Today and Ch. 24.

Project Management
The Flaw of Averages in Project Management
In 2011 I co-authored an article for the Project Management Institute on using SIP libraries and Excel to estimate the duration of simple projects. The original model stored the SIPs in compressed strings called DISTs, which required specialized software to run the simulations. This version has been converted to SIPmath for Excel.

SIPmath Gantt Project
A GANTT chart is the type of graph displaying the durations of tasks within a project. It shows the durations of various tasks over time. This file was created by adding SIPmath simulation to one of several online templates that appeared in Microsoft Office with a search for “GANTT.” Note that this model has a check box that switches it from deterministic to simulated. Guess which mode has the longest duration on average.

Financial Management
The Sum of the Sandbags Doesn’t Equal the Sandbag of the Sum
An age-old affliction in budgeting involves departments padding (sandbagging) their budgets just to be on the safe side. When these estimates are rolled up, the resulting overall budget is on the ridiculously safe side. That is, the resulting budget (sum of the sandbags) is greater than the budget required for the organization as a whole to be on the safe side (the sandbag of the sum).

The Government Finance Officers Association
City managers must keep money in reserves for potential adverse events such as forest fires or floods. This model demonstrates how such risks can be rolled up. The sandbag effect can be clearly seen and corrected for.

Surplus Deficit
This is a multi-period time-series model that uses a SIP Library based on disguised data from the projected revenues of Colorado Springs, CO, to estimate the chances of future deficits, depending on initial cash balance. See GFOA reference above and Ch. 59.

Markowitz Mean Variance Model
This is an example of the famous Nobel Prize-winning Mean Variance model of Harry Markowitz that ushered in Modern Portfolio Theory. This version lets the user choose among two SIP libraries, one with lognormal and one with fat tailed returns. See 1 and Ch. 22.

Consolidated Risk
Risk Register Rollup
The Risk Register is a way of propagating the Flaw of Averages on an industrial scale. Typically, average impacts of various risks are kept in some sort of data base, and because averages can be added, you can sum up the risks in a risk register to get the average total risk. But average total risk tells you nothing about the chances of any particular outcome. The main point of this book is that you can now add SIPs, which represent entire distributions. This model lets you slice and dice risk over any part of your organization, and determine the chance that any particular risk will exceed a particular threshold.

Factor Analysis of Information Risk - FAIR
The FAIR Standard is a systematic, probabilistic approach to modeling information risk. The model below implements Open Group.org’s Open FAIR™ Standard using ProbabilityManagement.org’s Open SIPmath™ Standard.

The Consolidated Risk Statement
This model continues the rollup theme across various business units and displays the effects of different mitigation strategies in terms of risk tolerance rather than averages. In a full-scale example, the SIPs in this model would be created on multiple platforms across the enterprise; for example, the FAIR model above, which are then rolled up to a single workbook or web application. See Ch. 40.

Healthcare
Nonlinear Healthcare Costs
This conceptual model shows that if the healthcare costs associated with number of pathogens per gallon of drinking water increase at an increasing rate, then the average cost is greater than the cost associated with the average number of pathogens. See Ch. 45.

Military Readiness
Operation Eagle Claw: The Poster Child for Bad Readiness Planning
Operation Eagle Claw was a failed mission to rescue the Americans hostages in Iran in 1980. Six helicopters were required to complete the mission, and the aircraft were considered to be 75% dependable. They sent eight, reasoning that 75% of eight was six. This is the correct average, but elementary statistics shows there was only a 68% chance of having enough helicopters complete one of the most important US military missions since WWII. See Ch. 37.

Portfolio of Transport Aircraft
In 2012, I co-authored an article with Phil Fahringer, a Lockheed Martin Fellow, on the conceptual tradeoffs between cost and lack of readiness in portfolios of military transport assets.11 This file, like the Shell Model above, uses a macro to let you click on a point on a tradeoff curve and observe the associated portfolio.

Agriculture
Farming Under Uncertainty
Imagine a region with highly uncertain rainfall. Based on average rainfall, which rarely occurs, you would plant a crop requiring a medium amount of water. But if you split your fields between a dry weather and a wet weather crop, you are more likely to survive all conditions.
